Get updates delivered to you daily. Free and customizable.
The 74
Which School Districts Do the Best Job of Teaching Kids to Read?
By Chad Aldeman,
7 hours ago
As poverty rates rise, reading proficiency rates tend to fall.
Every state has a downward-sloping line like this. But it’s not fate. Districts, schools and students nationwide are outperforming what might be expected of them.
Here’s the data for Ohio. Each dot is one district.
The dot way up in the top right corner is Steubenville City. Despite a relatively high poverty rate, nearly all its students read proficiently by third grade.
In this project, we set out to find and celebrate the Steubenvilles around the country.
According to the latest national results, low-income fourth graders read an average of two to three grade levels below their higher-income peers.
It’s not new that students in poverty have lower scores on reading tests than more affluent students. Housing prices, parent perceptions and online school ranking websites all focus on those raw, unadjusted scores, which ignore the fact that some schools and districts simply have a harder job.
But poverty is not destiny, and some schools and districts hugely outperform what might be expected of them based solely on which students they serve.
Working with Eamonn Fitzmaurice, The 74’s art and technology director, I set out to find districts around the country that succeed with the students they actually serve. We calculated each district’s expected reading proficiency rate, based on its local poverty rate, and compared it to its actual third grade reading scores. This methodology helped us identify districts that are beating the odds and successfully teaching kids to read.
Select from the menu below to find the high fliers in your state.
Steubenville City, in the Rust Belt along the very eastern edge of Ohio, topped our rankings. It has a very high poverty rate — greater than 96% of districts nationally — yet 99% of its third graders were proficient in reading last year. (For more on how Steubenville achieves such impressive results, see this 2012 story and this profile .)
Every state has its own pockets of success (represented as gold circles in the graphs). These “exceptional districts” are in the top 5% of their state, in terms of outscoring their expected reading proficiency rate. For example, Worcester County in Maryland serves about 7,000 students along the Atlantic coast. Worcester falls in the middle of the pack in terms of poverty, but it has by far the highest third grade reading proficiency rate in the state.
We found positive outliers in every state. Among these are some higher-income districts like Maryville, Tennessee; Mountain Lakes, New Jersey; and Bainbridge Island, Washington, that are exceeding already lofty expectations. They also include lower-income communities, like Dearborn, Michigan, and Neshoba County, Mississippi, that are helping students achieve results that — although maybe not high in absolute terms — should still be considered achievements, given the poverty the schools and students are facing.
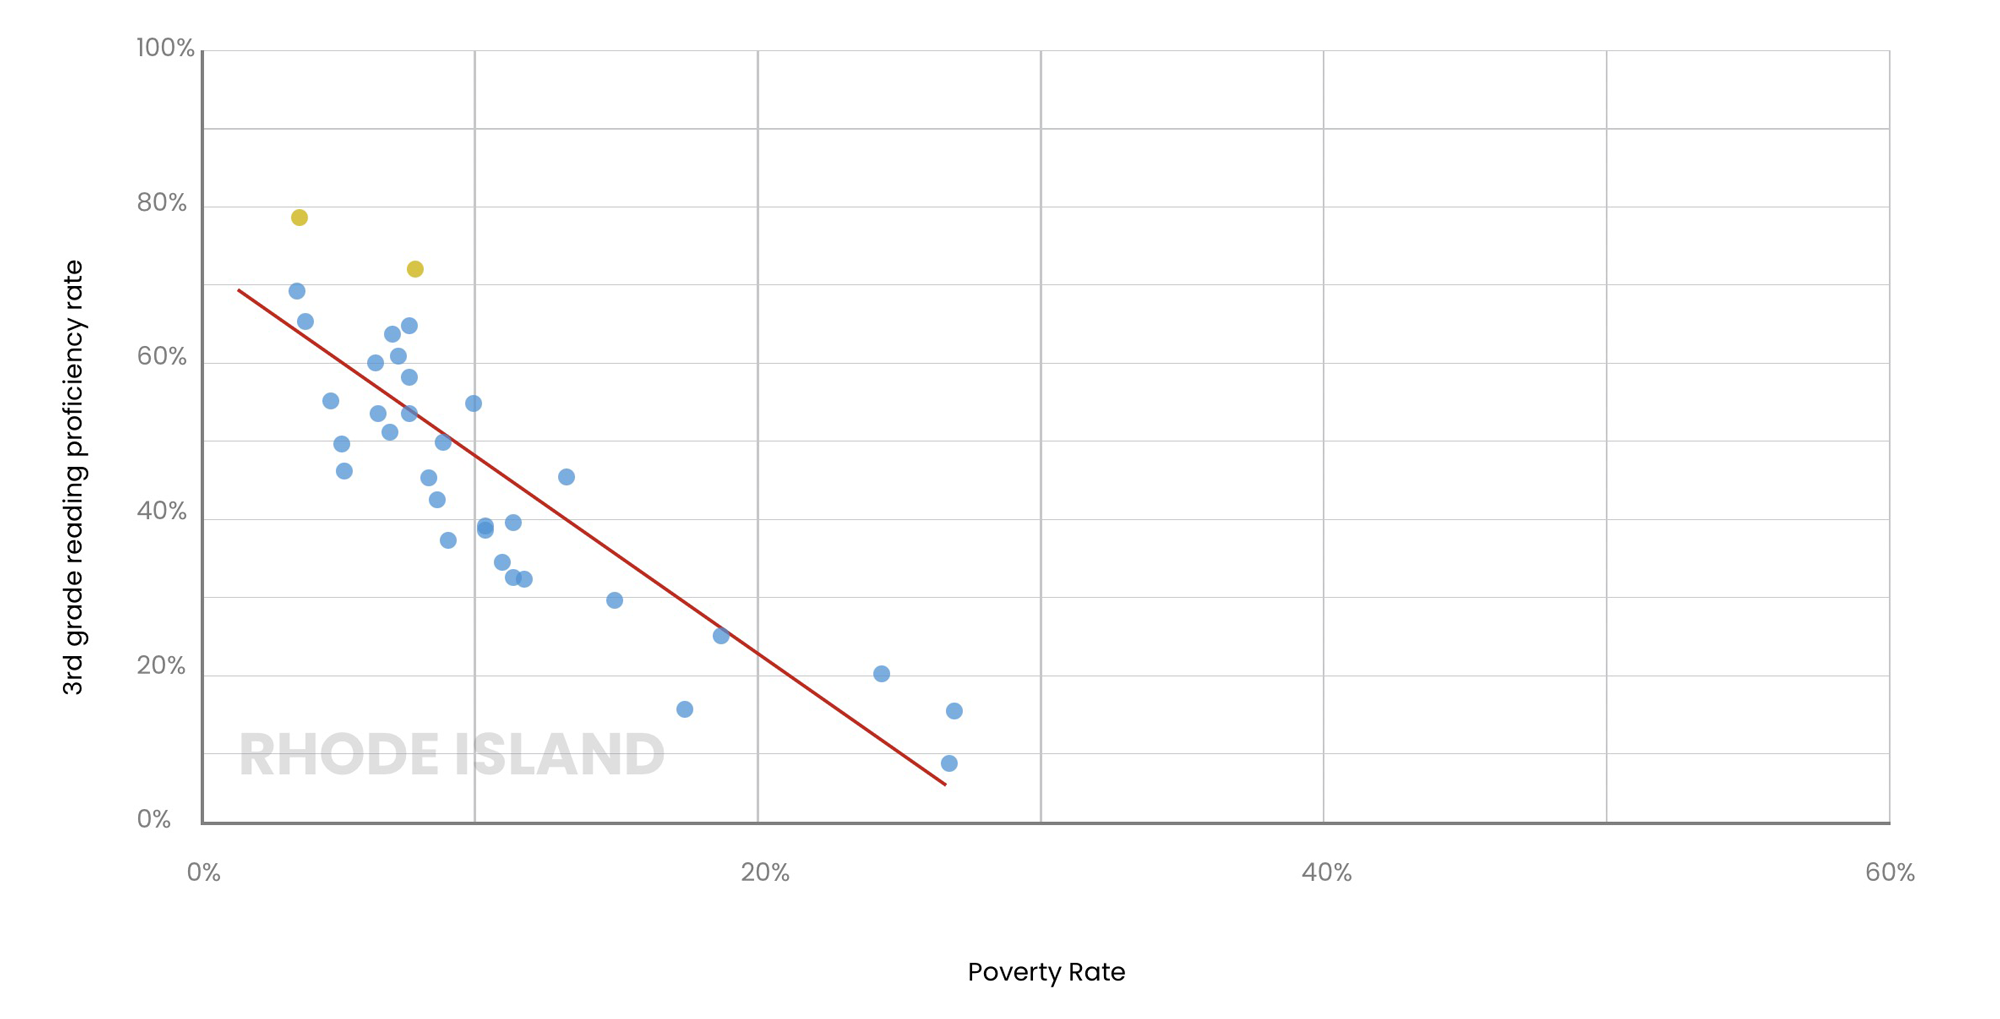
In some states, poverty has more of an effect than it does in others. Given the correlation between income and test scores, readers might assume that every state’s graph looks like Rhode Island’s, where poverty is highly correlated to district reading scores and districts are tightly bunched around those expectations.
The diagonal line in the graph is called the “best fit” line. It is meant to go through the middle of all the points on the graph, and the closer the points are to the line, the stronger the correlation is. After Rhode Island, Connecticut, Alabama, Massachusetts and Alaska have the strongest relationship between a district’s poverty rate and its third grade reading proficiency.
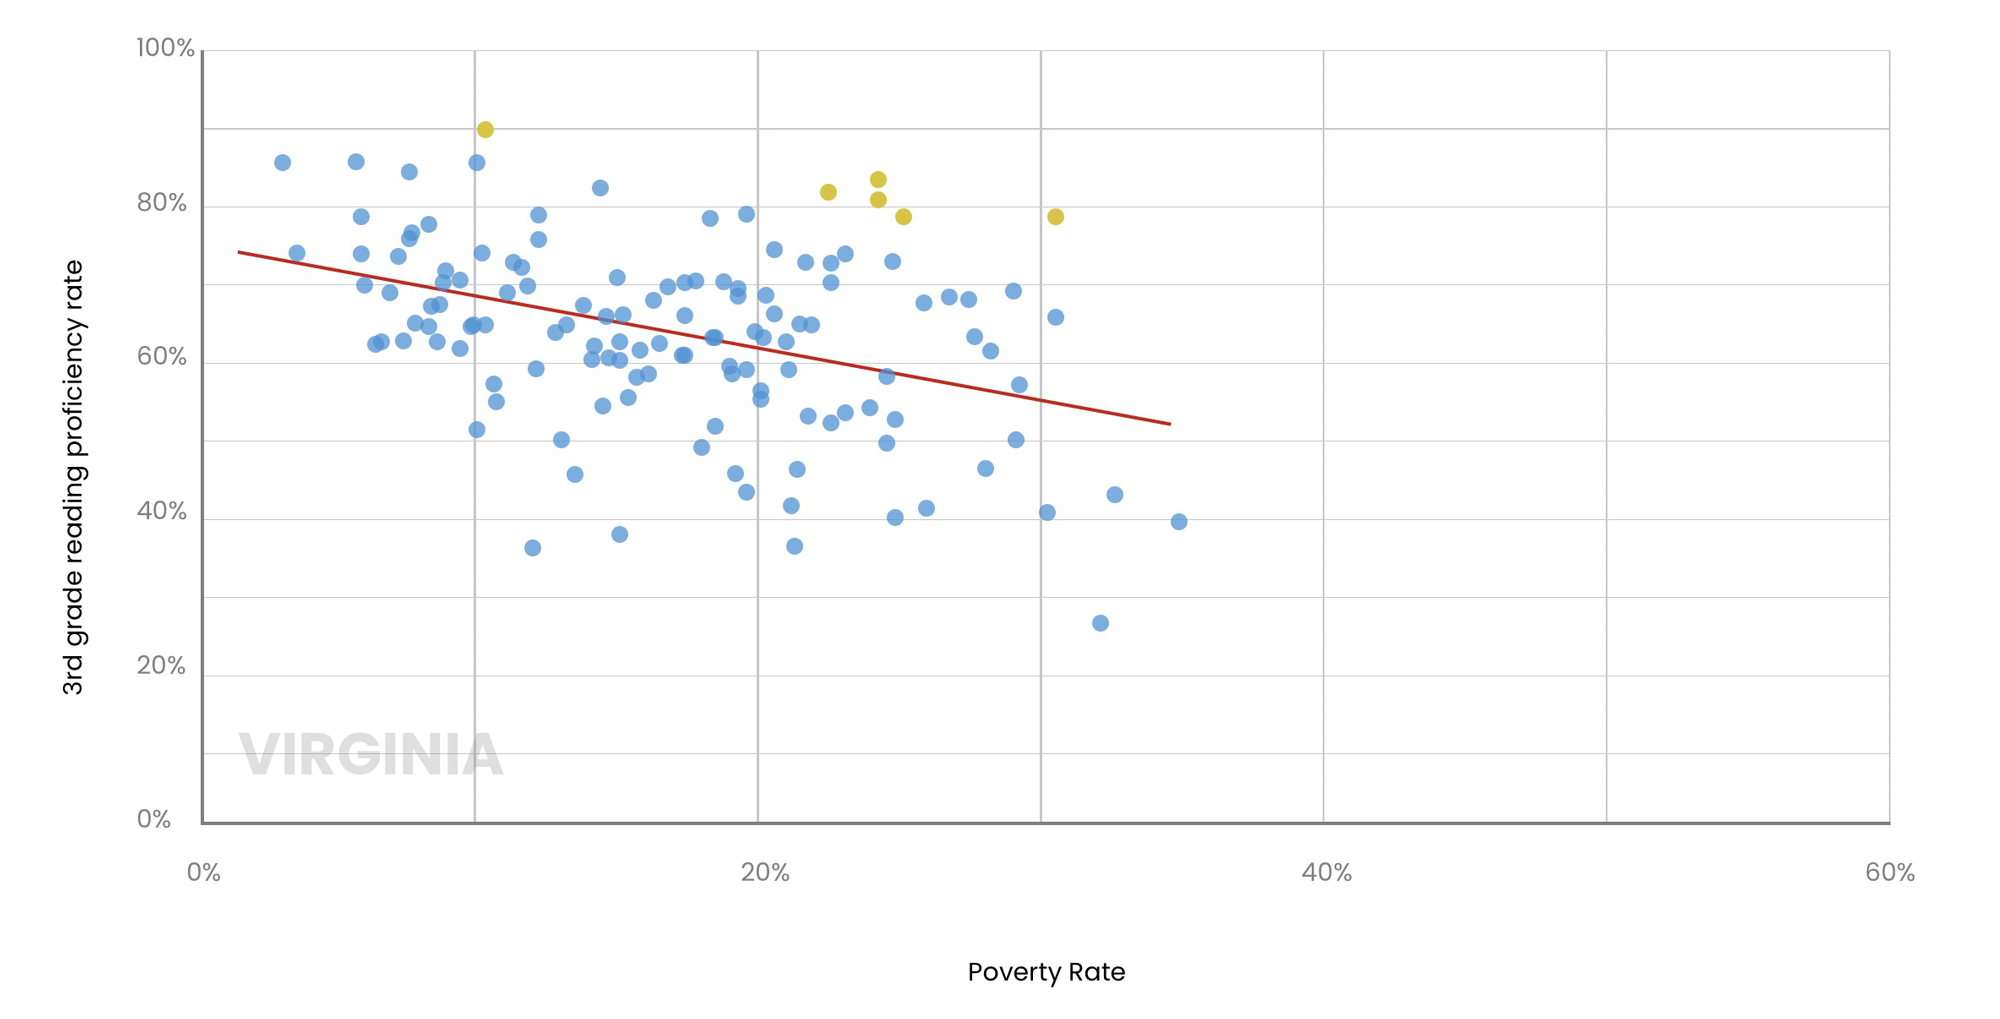
But not every state has such a tight relationship. For example, contrast how tightly districts are bunched around the “best fit” line in Rhode Island with the same graph (below) for Virginia. In Virginia, the relationship between poverty and reading scores is much weaker.
States like Nebraska, West Virginia, Kentucky, North Dakota and especially Nevada have weaker relationships between district-level poverty and reading outcomes. The number of districts a state has, how students are sorted across districts and differences in the state tests themselves can all affect this relationship.
But without controlling for poverty, a “good” school district may receive credit for student learning that it actually had little part in. This issue is especially misleading in reading. Unlike math, where learning is more closely tied to school-based instruction, reading skills are multi-faceted, and they’re more closely tied to language skills and background knowledge that children acquire at home.
As a result, some wealthier districts may show high (raw) reading scores even though their students are picking up their skills at home — or, worse, from private tutors that families with means are able to afford out of their own pockets. Meanwhile, districts doing a good job serving low-income students have a harder time showing the same proficiency rates. But some truly are beating the odds at helping kids learn to read, and their leaders deserve praise and celebration.
Methodology and Limitations: The data for this project come from two sources. Poverty rate data comes from the 2022 district-level figures from the Small Area Income and Poverty Estimates (SAIPE) Program . Third-grade reading scores were downloaded from Zelma.ai , an initiative from ParentData.org and Brown University to compile state test scores and make them publicly available.
Because the poverty rate data from SAIPE is reported at the district level, we could not look at results for individual schools. The data also do not include standalone charter schools, so these are included when they are part of a district but not when they are considered their own district. Similarly, the data provide only one poverty rate for all of New York City, so readers should interpret those results with caution.
We limited our sample to districts with at least 30 test-takers in spring 2023. Because different states use different tests, we encourage readers to focus on within-state comparisons only. For example, we could not include places with only one district (e.g. Hawaii and the District of Columbia). Vermont had not reported its 2023 district-level proficiency rates by the time of publication, so it is excluded. Maine did not break its results down by grade level, so its numbers use an aggregate across grades 3 to 8. All told, we had comparable data for 9,605 districts across the country.
Get updates delivered to you daily. Free and customizable.
It’s essential to note our commitment to transparency:
Our Terms of Use acknowledge that our services may not always be error-free, and our Community Standards emphasize our discretion in enforcing policies. As a platform hosting over 100,000 pieces of content published daily, we cannot pre-vet content, but we strive to foster a dynamic environment for free expression and robust discourse through safety guardrails of human and AI moderation.


 Local News